Getting Started with the S32K116EVB2Q048 Evaluation Board
Contents of this document
-
Out of the Box
-
Get Software
-
Plug It in
-
Build, Run
-
Debug
Sign in to save your progress. Don't have an account? Create one.

Purchase your S32K116-Q048 Evaluation Board for Automotive General Purpose
1. Out of the Box

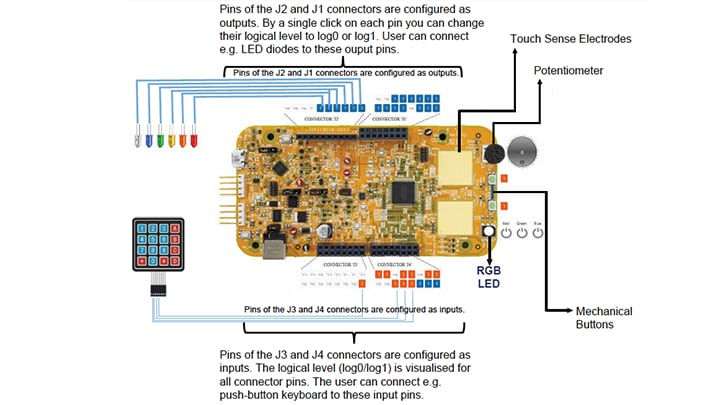
1.3 Understanding the HMI Mapping
| Component | S32K118 |
|---|---|
| Red LED | PTD16 (FTM0 CH1) |
| Blue LED | PTE8 (FTM0 CH6) |
| Green LED | PTD15 (FTM0 CH0) |
| Potentiometer | PTA7 (ADC0_SE3) (DNP) |
| SW2 | PTD3 |
| SW3 | PTD5 |
| OpenSDA UART TX | PTB1 (LPUART0_TX) |
| OpenSDA UART RX | PTB0 (LPUART0_RX) |
| CAN TX | PTE5 (CAN0_TX) |
| CAN RX | PTE4 (CAN0_RX) |
| LIN TX | PTC9 (LPUART1_TX) |
| LIN RX | PTC8 (LPUART1_RX) |
| SBC_SCK | PTB2 (LPSPI0_SCK) |
| SBC_MISO | PTB3 (LPSPI0_SIN) |
| SBC_MOSI | PTB4 (LPSPI0_SOUT) |
| SBC_CS | PTB5 (LPSPI0_PCS1) |
2. Get Software
2.1 Download the EVB Jump Start Software
Download the code and run it to get familiar with your S32K116EVB2Q048.
Download S32K116EVB2 Jump Start SW
2.2 Get the Integrated Development Environment (IDE)
S32K116EVB2Q048 evaluation board performs better when using S32 Design Studio for Arm®
Download S32 DESIGN STUDIO IDE
3. Plug It in
Let's take your S32K116-Q048 for a test drive.
You have the choice of watching a short setup video or following the detailed actions listed below.
3.1 Set Up Jumpers in the S32K116EVB2Q048
| Jumper | Configuration | Description |
|---|---|---|
J104 |
1-2 (Default) 2-3 |
Reset signal to OpenSDA, use to enter into OpenSDA Bootloader mode Reset signal direct to the MCU, use to reset S32K11x. |
J107 |
1-2 (Default) 2-3 |
S32K11x powered by 12 V power source. S32K11x powered by USB micro connector. |
J10 |
2-3 (Default) 1-2 |
MCU voltage 5 V MCU voltage 3.3 V |
J108 |
1-2 (Default) | Select LIN master option |
J15 |
1-2 (Default) | Used for current measurement |

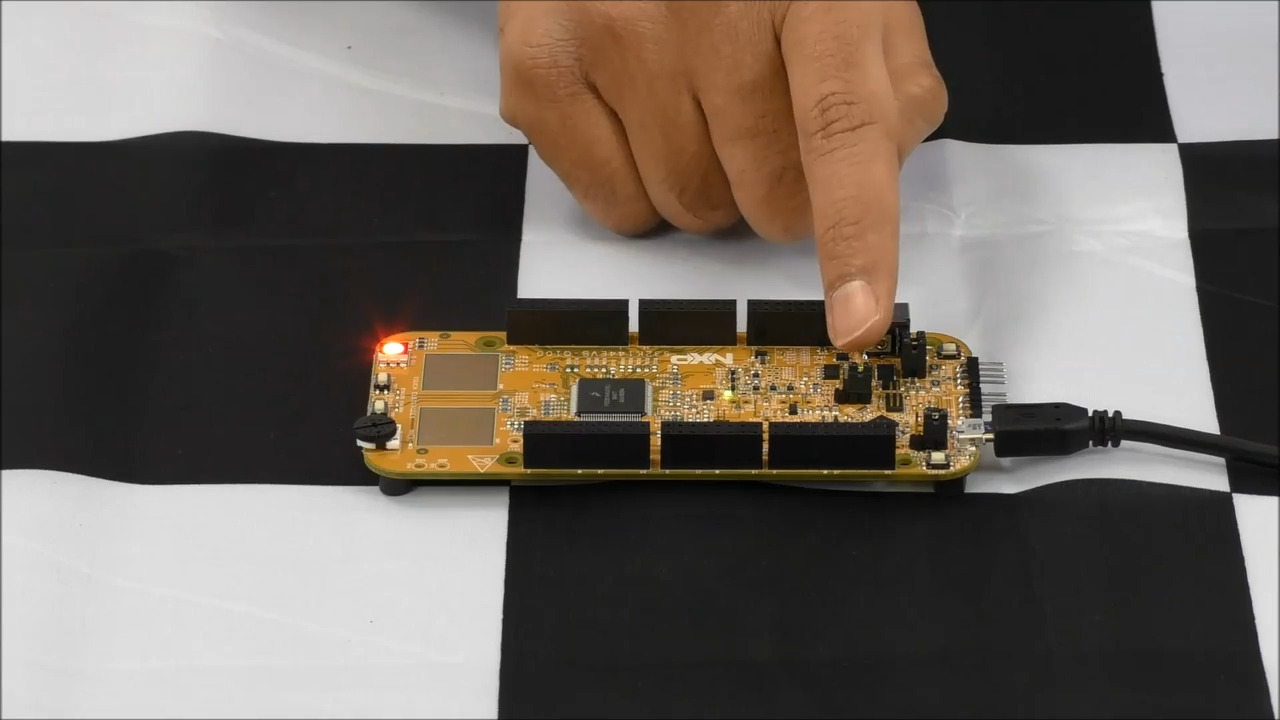
3.2 Plug in the 12 V Power Supply
The S32K116EVB2Q048 or S32K118EVB2Q048 evaluation boards power from a USB or external 12 V power supply. By default 12 V power is enabled with J107.
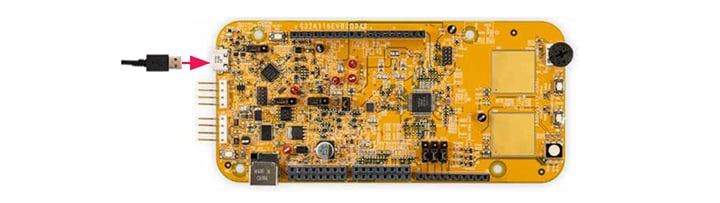
Connect the USB cable to a PC using the supplied USB cable.
Connect the other end of the USB cable (microUSB) to the mini-B port on S32K116EVB2Q048 or S32K118EVB2Q048 at J7
Allow the PC to automatically configure the USB drivers if needed.
Debug is done using OpenSDA through J7
When powered through USB, LEDs D2 and D3 should light green.
Once the board is recognized, it should appear as a mass storage device on your PC with the name S32K116EVB2Q048 or S32K118EVB2Q048.

Board is preloaded with a software, in which the red, blue and green LEDs will toggle at different rates.

4. Build, Run
Let's take your S32K116EVB2Q048 or S32K118EVB2Q048 boards for a test drive.
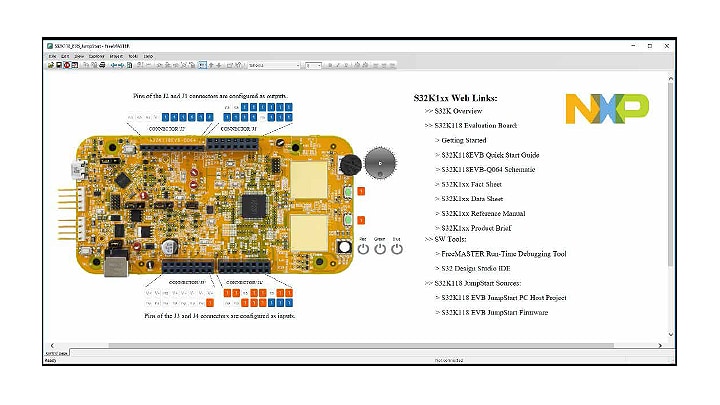
4.1 Communicate with Run-Time Debugger
Launch the FreeMASTER application:

Configure the communication port through OpenSDA with a 115200 b/s speed rate:
Manually = Project → Options → Comm

Automatically = Tools → Connection Wizard

Learn more about OpenSDA at Projects and Tutorials.
4.2 FreeMASTER JumpStart Project Loaded
The FreeMASTER JumpStart project description:
Learn more about the FreeMASTER JumpStart project features at Projects and Tutorials.
4.3 Import and Debug the Project to IDE
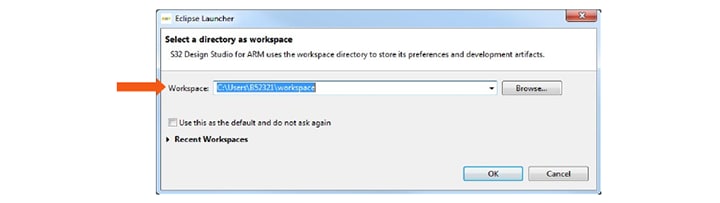
Launch the S32 Design Studio for Arm and select a default Workspace or specify a new one, then click OK.
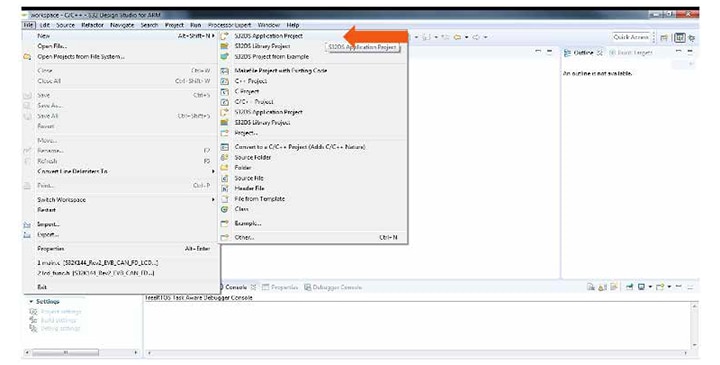
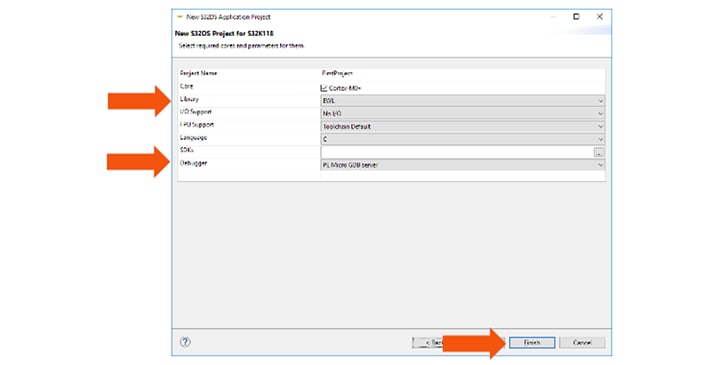
To create a new project, select File → New → Project
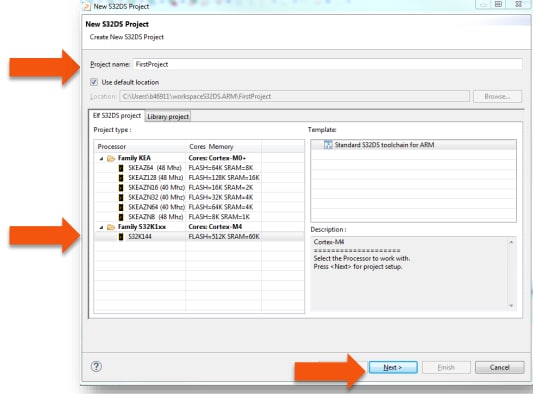
Choose a project name and then select a project type, then click Next.
Select Debugger Support and Library Support, then click Finish.
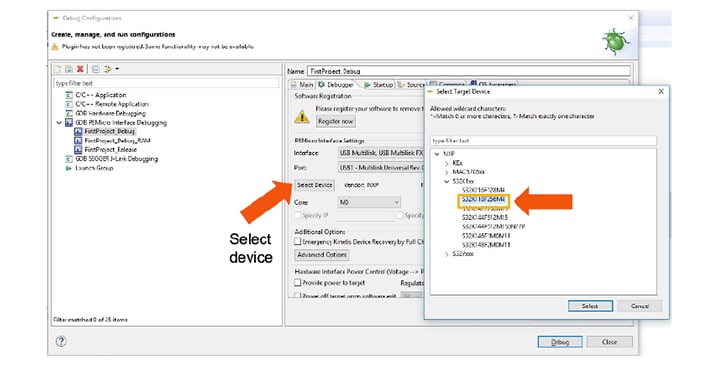
4.4 Set Up Debug Configuration
Select OpenSDA to debug with it.
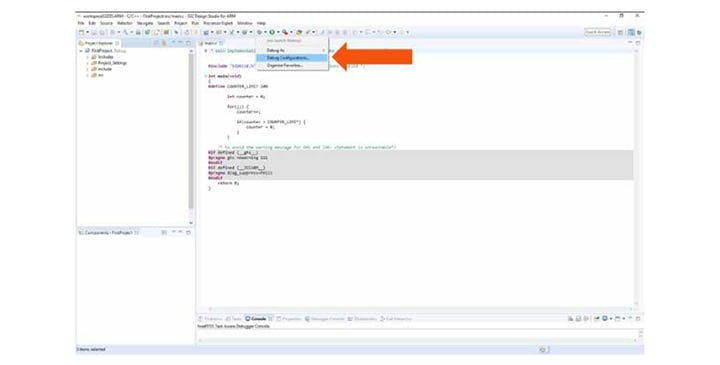
Select your project, and click on Debug Configuration.
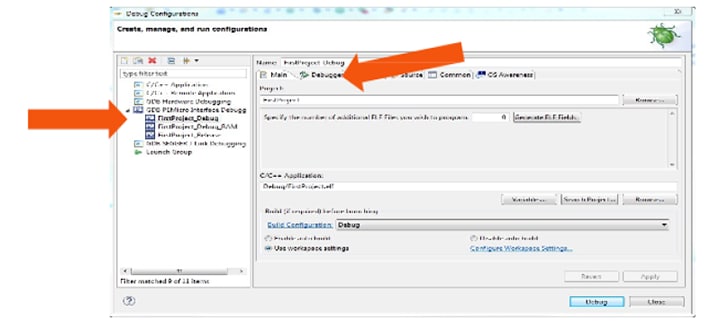
Select the debug configuration under GDB PEMicro Interface Debugging, click the Debugger tab.
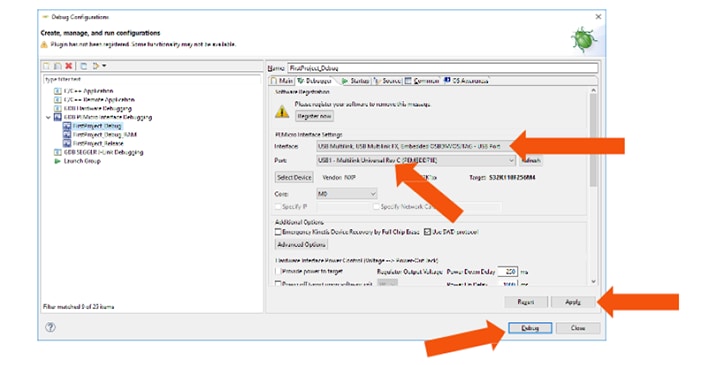
In Interface, select OpenSDA. If your board is plugged in, it should appear in Port.
To finish, click Apply then Debug.
5. Debug
5.1 Starting the Debugger
Debug configuration is only required once. Subsequent starting of debugger does not require those steps.
-
Three options to start the debugger:
- If the Debug Configuration has not been closed, click on the Debug button on bottom right
- Select Run - Debug (or hit F11)
-
Recommended method: Click on the pull down arrow for bug icon and select
…_debug.elftarget


5.2 Debug Basics
Step Into (F5)

Step Over (F6)

Step Return (F7)

Run

Suspend

Resume (F8)

View Variables
Click the Variables tab. To enter different values, click in the Value field.

View and Alter Registers
To see CPU registers, click the Registers tab. To enter different values, click in the Value field.

View peripheral registers in the EmbSys Registers tab:

View and Alter Memory
Select Add Memory Monitor and then select the base address to: 40000000


View Memory

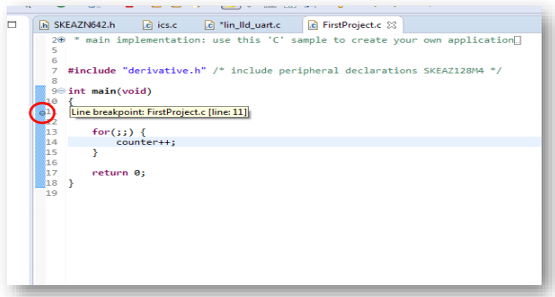
Breakpoints
To add break points, point and click in the desired location.
Reset and Terminate the Debug Session
To reset the program counter, select Terminate (Ctrl+F2).


FreeMASTER JumpStart


Introduction to OpenSDA
Introduction to OpenSDA
OpenSDA is an open-standard serial and debug adapter. It bridges serial and debug communications between a USB host and an embedded target processor. OpenSDA software includes a flash-resident USB mass-storage device (MSD) bootloader and a collection of OpenSDA applications.
The S32K116EVB2Q048 comes with the MSD Flash Programmer OpenSDA Application preinstalled.
Follow these instructions to run the OpenSDA Bootloader and update or change the installed OpenSDA Application.
| Enter OpenSDA Bootloader Mode | Load an OpenSDA Application |
|---|---|
A removable drive should now be visible in the host file system with a volume label of BOOTLOADER. You are now in OpenSDA Bootloader mode. |
You are now running the latest version of the MSD Flash Programmer. Use this same procedure to load other OpenSDA Applications. |
The MSD Flash Programmer is a composite USB application that provides a virtual serial port and an easy and convenient way to program applications into the KEA MCU. It emulates a FAT16 file system, appearing as a removable drive in the host file system with a volume label of S32K116EVB2Q048. Raw binary and Motorola S-record files that are copied to the drive are programmed directly into the flash of the KEA and executed automatically. The virtual serial port enumerates as a standard serial port device that can be opened with standard serial terminal applications.
| Using the MSD Flash Programmer | Using the Virtual Serial Port |
|---|---|
The new application should now be running on the S32K116EVB2Q048. Starting with v1.03 of the MSD Flash Programmer, you can program repeatedly without the need to unplug and reattach the USB cable before reprogramming. Drag one of the |
|
On this page
- 1.1
Get to Know the S32K116EVB2Q048 Evaluation Board
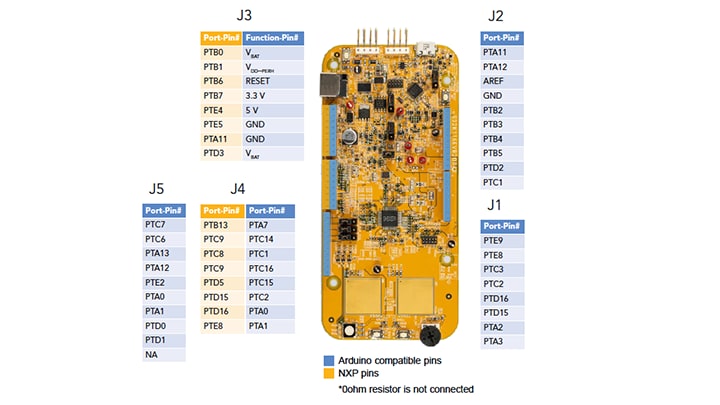
- 1.2
Understanding the Header/Pinout for the S32K116EVB2Q048
- 1.3
Understanding the HMI Mapping
- 2.1
Download the EVB Jump Start Software
- 2.2
Get the Integrated Development Environment (IDE)
- 2.3
Get the Run-Time Debugging Tool